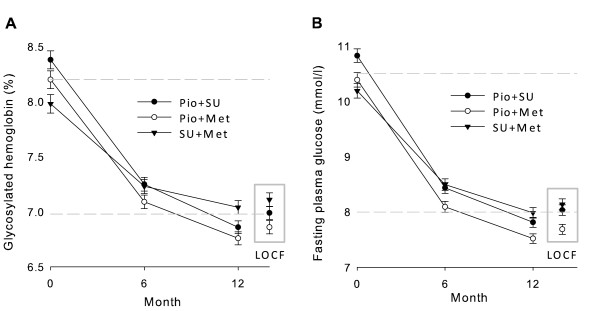
Figure 3.
Evolution of glycosylated hemoglobin (A) and fasting plasma glucose (B) from baseline to Month 12. Data points are mean values and error bars represent 95% CIs. The 2 dashed horizontal lines mark the range between baseline and Month 12 (LOCF data) mean levels of each variable for the total population.

