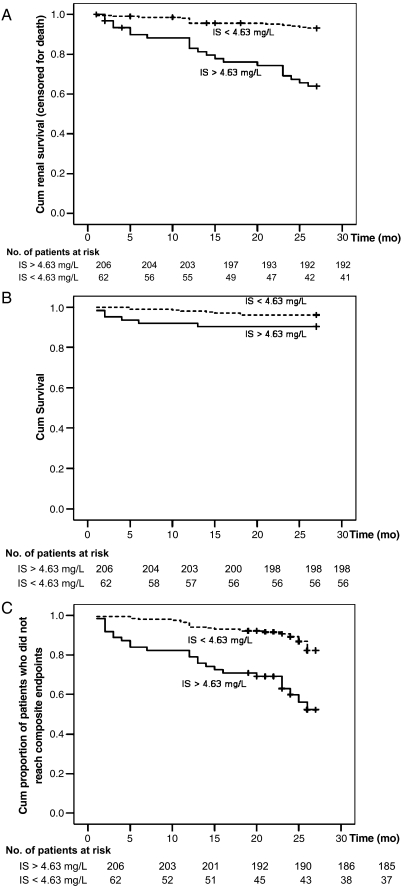
Fig. 3.
Kaplan–Meier survival curves in all patients according to serum IS level (above and below the median of 4.63 mg/L); (A) cumulative renal survival (censored for death), log-rank, P < 0.001; (B) cumulative survival, log-rank, P = 0.062; (C) cumulative proportion of patients who did not reach composite endpoints, log-rank, P < 0.001.

