
Figure 6.
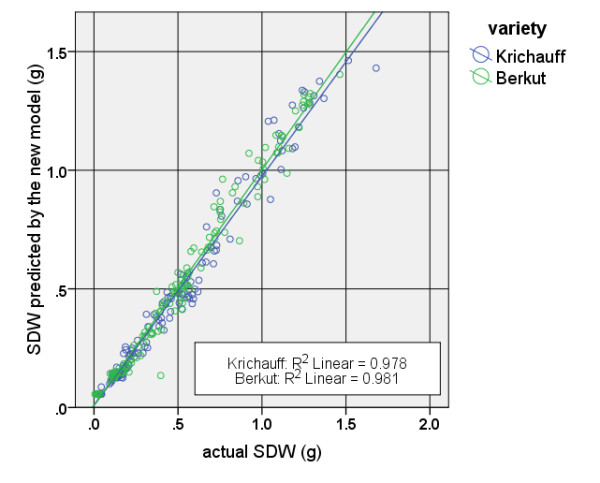
Scatter plots of actual SDW compared with the estimated values obtained using the model proposed in this study for two wheat varieties.
Official websites use .gov
A
.gov website belongs to an official
government organization in the United States.
Secure .gov websites use HTTPS
A lock (
) or https:// means you've safely
connected to the .gov website. Share sensitive
information only on official, secure websites.
Scatter plots of actual SDW compared with the estimated values obtained using the model proposed in this study for two wheat varieties.