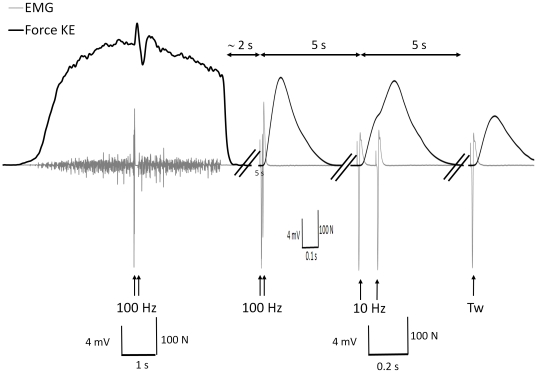
Figure 2. Typical torque and EMG traces during voluntary and electrically evoked contractions.
Typical torque trace (black line) during the knee extensor maximal voluntary contraction and determination of maximal activation level, as well as high- and low frequency doublets (100 Hz and 10 Hz, respectively) and single twitch, after the mountain ultra-marathon. The black arrows indicate the timing of delivery of the stimuli. EMG is represented with a grey line.

