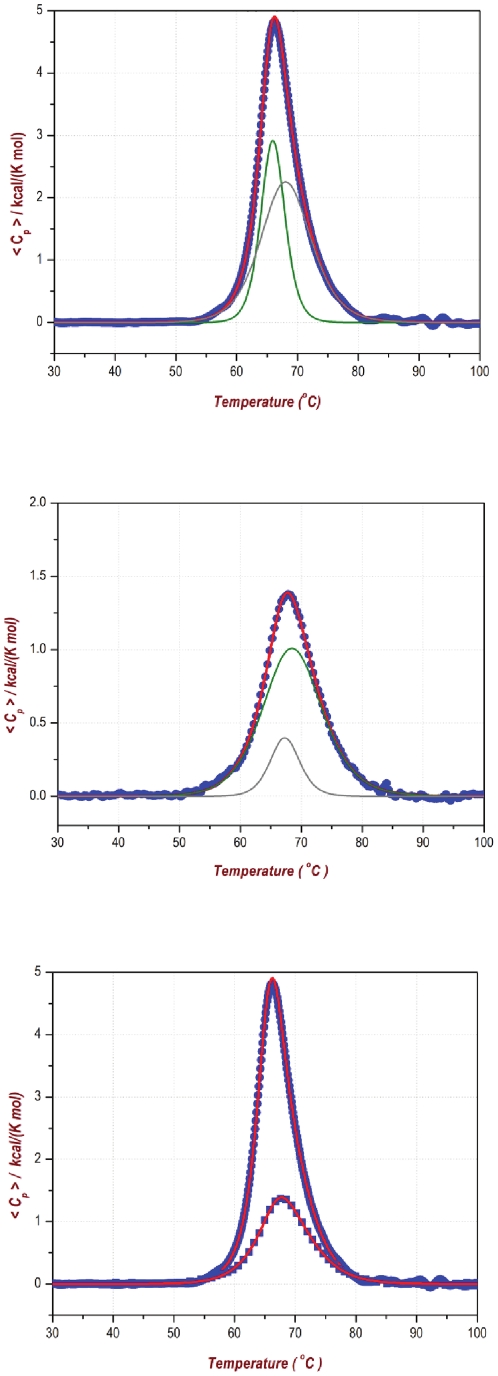
Figure 4. DSC of PsTRXh2.
The top panel shows the calorimetric curve of the first scan with the analysis to a three-state model, indicating the two transitions (in green). The middle panel shows the calorimetric curve of the re-heating scan with a three-state model (in green), indicating the two transitions. The bottom panel shows both scans to allow for a comparison.

