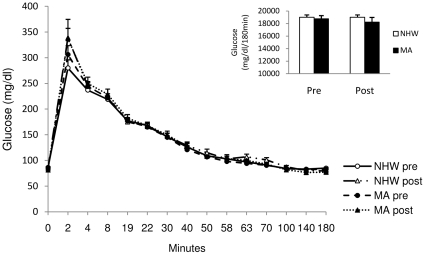
Figure 1. Plasma glucose area under the curve during the 3 h IVGTT for NHW and MA males and females before and after the diet-exercise intervention.
Glucose AUC was not different between ethnicities pre or post intervention and did not change after the intervention. Values are means ± SE. AUC values were calculated using the trapezoidal method [32]. NHW n = 19, MA n = 14.

