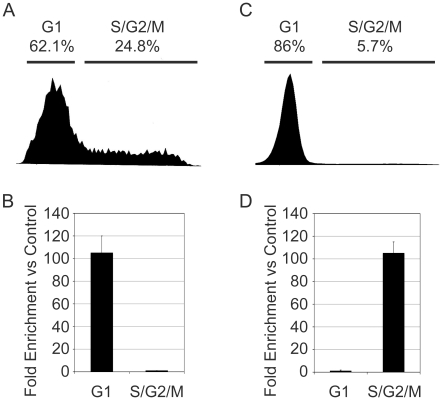
Figure 6. Cell cycle specific targeting of c-Myb in primary cells and leukemias.
(A) Cell cycle histograms of primary CD34+ cells that were fixed and sorted into G1 or S/G2/M cell cycle fractions. The percentage of cells in each fraction is indicated at top. (B) Chromatin was prepared from equal numbers of CD34+ cells that were fixed and sorted into the G1 or S/G2/M fractions and used for ChIP assays as described in Figure 3, using anti-Myb antibodies. QPCR assays were used to measure enrichment of the KIT gene promoter. Results are relative to enrichment of a control region of the GAPDH gene to which c-Myb does not bind. Error bars show standard deviation of triplicate QPCR assays. (C) Cell cycle histogram of cryopreserved, primary human AML cells that were thawed and immediately fixed with formaldehyde, stained with Hoechst 33342 and sorted into G1 or S/G2/M fractions. (D) Equal numbers of sorted AML cells from each fraction were used to prepare chromatin and perform ChIP assays using anti-Myb antibodies. QPCR was used to measure the enrichment for the CXCR4 gene promoter, as described in Figure 3. Results are relative to enrichment of a control region of the GAPDH gene to which c-Myb does not bind. Error Bars show standard deviation of triplicate QPCR reactions. Note: The experiments in this figure were performed at least twice, using cells from two different donors or patients, and all gave similar results. The results shown are from a single experiment but are representative of all the trials.

