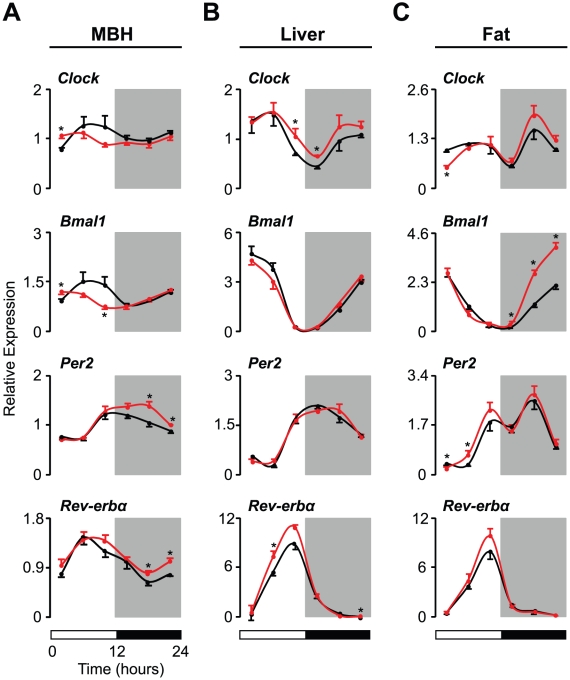
Figure 3. Clock gene expression is altered in metabolic tissues of SHR.
[Note that the data in this figure were derived from the same animals represented in Figure 1 (the mediobasal hypothalamus, MBH) and Figure 2 (liver and visceral fat).] Transcript levels of core clock genes (Clock, Bmal1, Per2, and Rev-erbα) in (A) the MBH, (B) the liver, and (C) visceral fat were determined by real-time PCR in WKY (black lines, n = 6 per time point) and SHR (red lines, n = 6 per time point). Values are displayed as relative expression levels normalized to β-actin. White and black bars below the figures represent the 12∶12 LD cycle. All data represent means ± SEM. *p<0.05.

