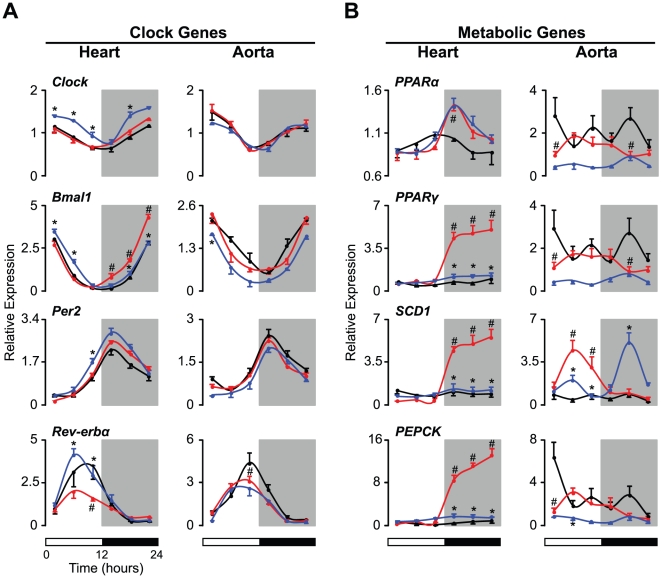
Figure 5. Effects of restricted feeding on clock and metabolic gene expression in cardiovascular tissues of SHR.
The levels of transcripts from (A) clock and (B) metabolic genes in the heart and aorta were determined by real time PCR. Animals were either fed ad libitum or exposed to an RF regimen, in which food was provided exclusively during the dark period, for 5 consecutive days. Heart and aorta tissues were harvested every 4 hr on the fifth day under these feeding conditions. For visual clarity, only data from the ad libitum-fed WKY (black lines, n = 4 per time point) and SHR (red lines, n = 4 per time point) and RF-fed SHR (blue lines, n = 4 per time point) are shown. Values for mRNA expression are displayed as relative expression levels normalized to β-actin. The 12∶12 LD cycle is indicated by the bars at the bottom of the figure. All data are expressed as means ± SEM. #, SHR versus WKY; *, SHR fed ad libitum versus RF; p<0.05.

