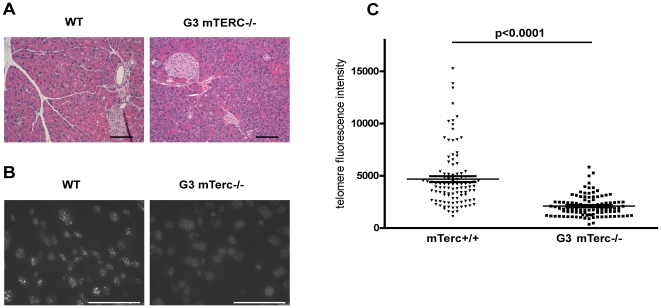
Figure 1. Normally developed pancreas despite shortened telomeres in telomerase knockout mice.
(A) Representative H&E sections of mTerc+/+ and G3 mTerc−/− mice reveal no differences in pancreas histology (size bar = 1 mm). (B) Telomere qFISH analysis reveals significantly decreased telomere fluorescence intensity in pancreata of G3 mTerc−/− compared to mTerc+/+ mice (size bar = 50 µm). Depicted is an overlay of a representative DAPI (dark grey shaped nuclei) and corresponding telomere FISH signal (white dots; TFI = telomere fluorescence intensity). (C) Quantification of telomere fluorescence intensity. n = 5 mice per group; 20 nuclei per mouse were counted.

