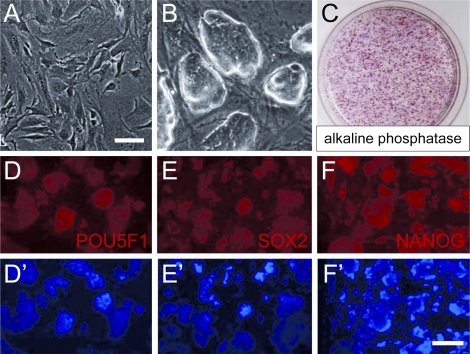
FIG. 4.
Generation and characterization of S3 mouse iPS cell line. A) MEFs prior to reprogramming. B) iPS cells colonies. C) Alkaline phosphatase staining of iPS cell colonies. D–F) S3 iPS cell colonies immunostained for POU5F1 (D), SOX2 (E), and NANOG (F). D′–F′) 4′,6-diamidino-2-phenylindole (DAPI) staining of D–F. Scale bars: A, B = 50 μm; D–F′ = 100 μm.

