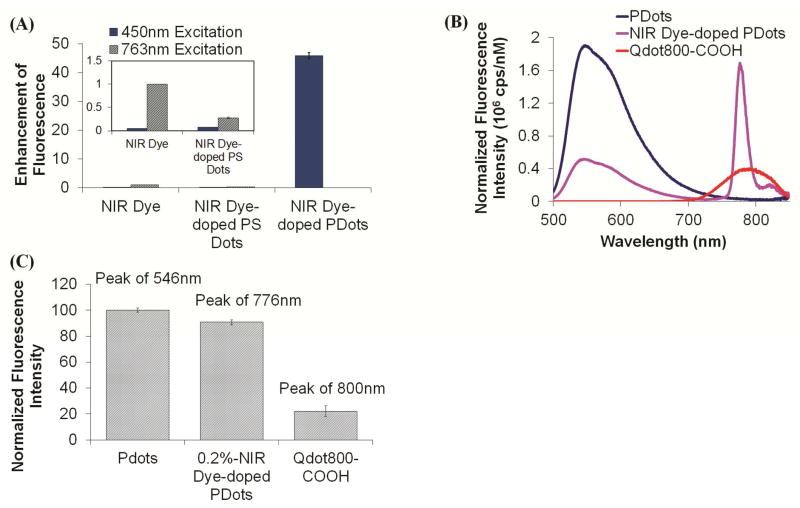
Figure 4.
Fluorescence enhancement of NIR775 doped inside PFBT Pdot matrix. (A) Normalized fluorescence peak intensities of free NIR775 dyes, NIR775 dyes doped in PS dots, and NIR775 doped in PFBT Pdots. For PFBT Pdots, excitation was at 450 nm (blue columns) and for free NIR775 and NIR775 doped in PS, excitation was at 763nm (black patterned columns). The fluorescence of free NIR dyes was measured in THF, while the others were measured in 20 mM HEPES buffer (pH 7.4). (B) Fluorescence emission intensities, using identical particle concentration, of bare PFBT Pdots, NIR775-doped Pdots, and Qdot800. (C) The peak fluorescence intensity of bare PFBT Pdots, NIR775-doped Pdots, and Qdot800 normalized by the particle concentration.

