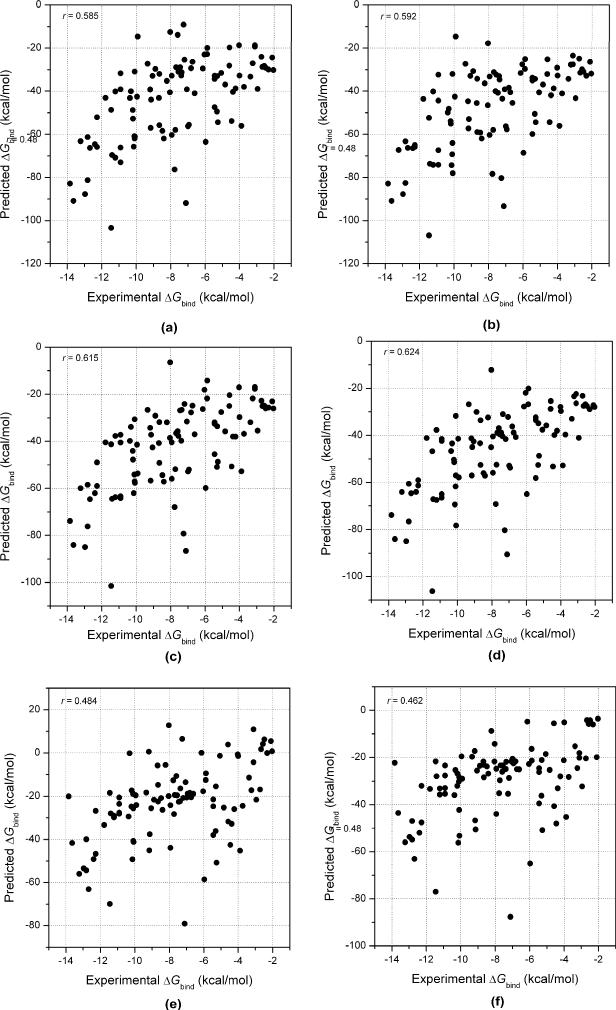
Figure 5.
The linear correlations coefficients between the experimental binding free energies and the predicted values given by (a) MM/GBSA using the GBHCT model and the solute dielectric constant of 2 based on the experimentally observed conformations, (b) MM/GBSA using the GBHCT model and the solute dielectric constant of 2 based on the best scored conformations, (c) MM/GBSA using the GBOBC1 model and the solute dielectric constant of 2 based on the experimentally observed conformations, (d) MM/GBSA using the GBOBC1 model and the solute dielectric constant of 2 based on the best scored conformations, (f) MM/PBSA using the solute dielectric constant of 2 based on the experimentally observed conformations, (g) MM/PBSA using the solute dielectric constant of 2 based on the best scored conformations.

