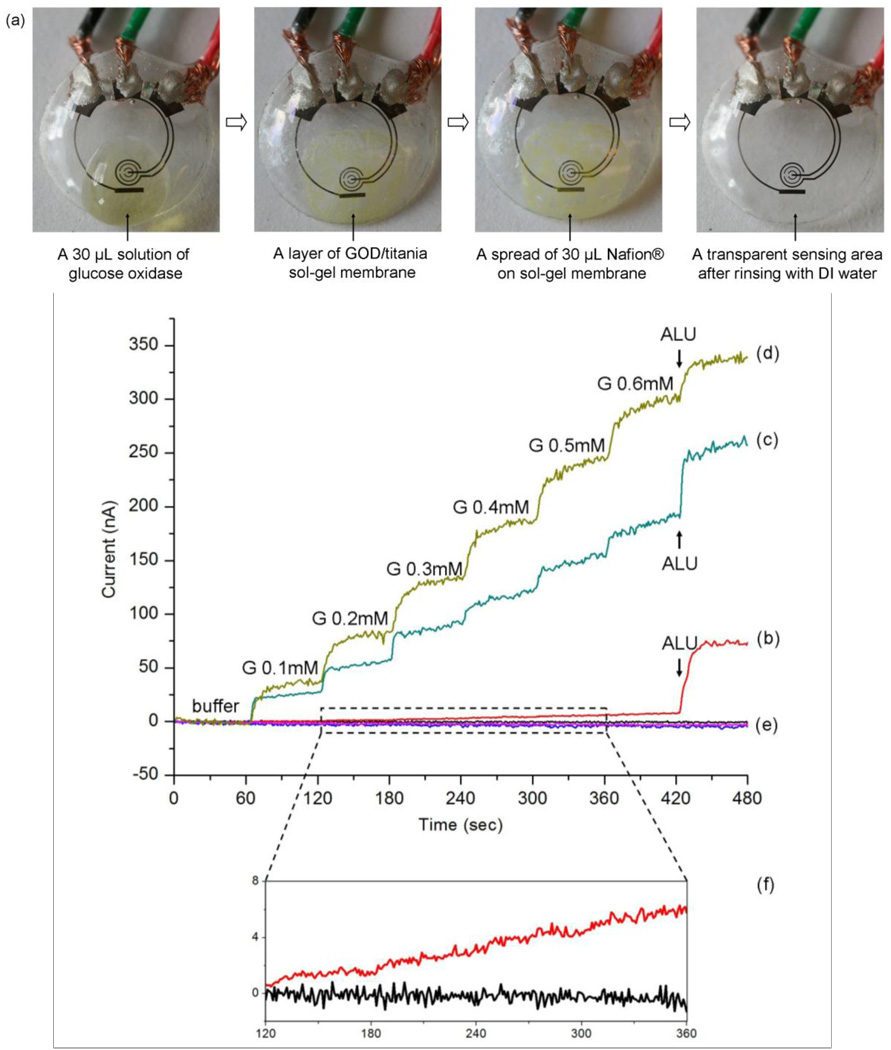
Fig. 2.
Images of the sensor as it goes through surface functionalization and the related measured responses. (a) sequential images of sensor pre-treatment with GOD/titania/Nafion®; (b) measured amperometric response for the sensor just incubated with GOD; (c) measured amperometric response for the sensor prepared with GOD/titania sol-gel film; (d) measured amperometric response for the sensor prepared with GOD/titania/Nafion®; (e) three controls (signals for buffer) for the same pretreatment of (b), (c), and (d); (f) the enlarged view of curve (b) and control of (b) for 120–360 sec.

