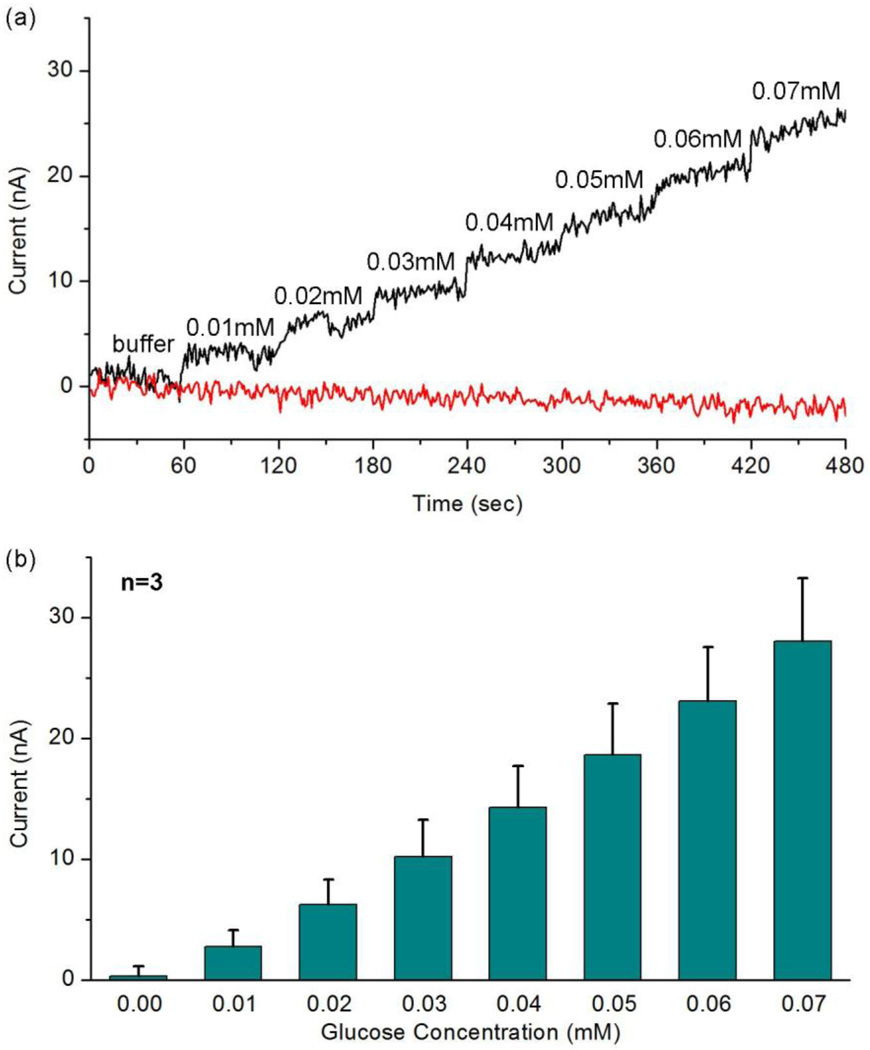
Fig. 5.
Measured amperometric response for very low concentrations (0.01–0.07 mM) of glucose: (a) the amperometric response for successive addition of 0.01 mM glucose and addition of the same amount of buffer; (b) calibration currents based on three different sensors (n=3). The current signals here are generated by averaging current values of 30–50 sec after each addition.

