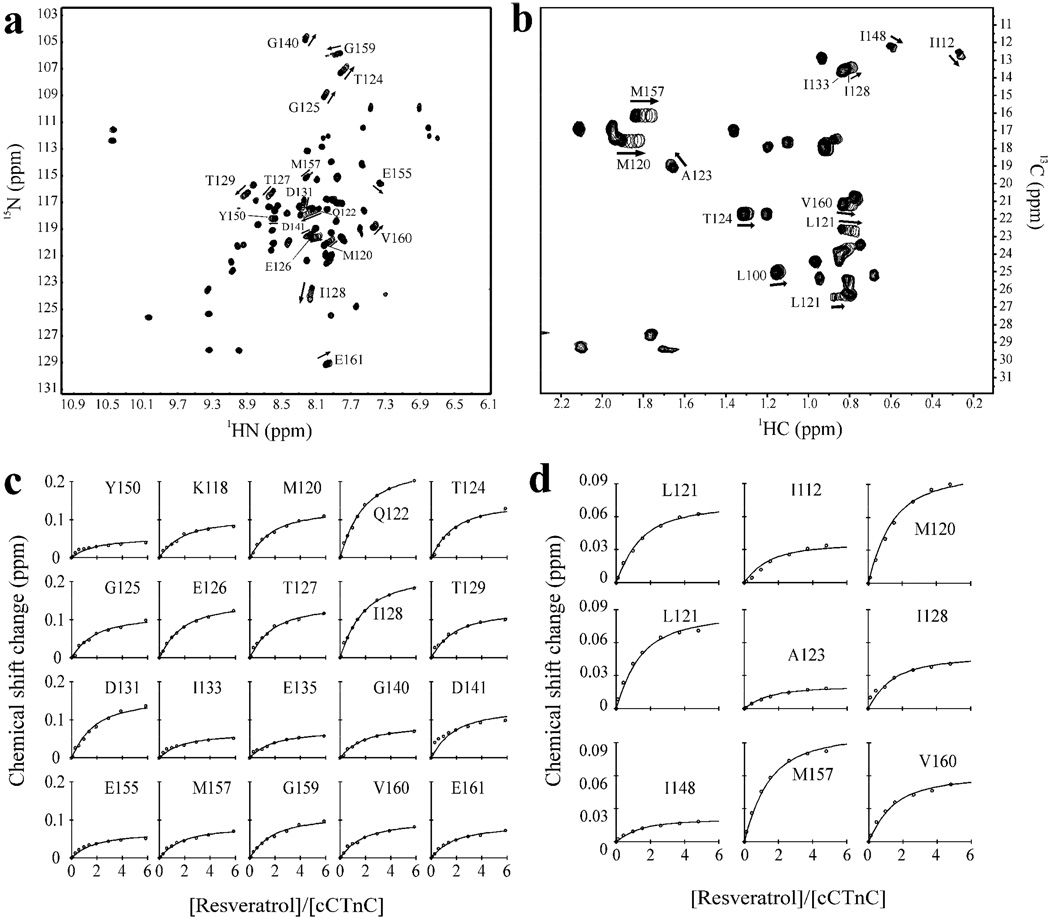
Fig. 3. Binding of resveratrol to cCTnC.
a. 1H,15N-HSQC and b. 1H,13C-HSQC (methyl-region) spectra of cCTnC acquired throughout the titration with resveratrol. The first point in the titration is represented with all 20 contours; whereas, each titration point with resveratrol is represented by a single contour. Direction of CSPs are indicated by arrows for several peaks. c. fitting of 1H,15N-HSQC and d. 1H,13C-HSQC NMR data with xcrvfit to determine the dissociation constant.

