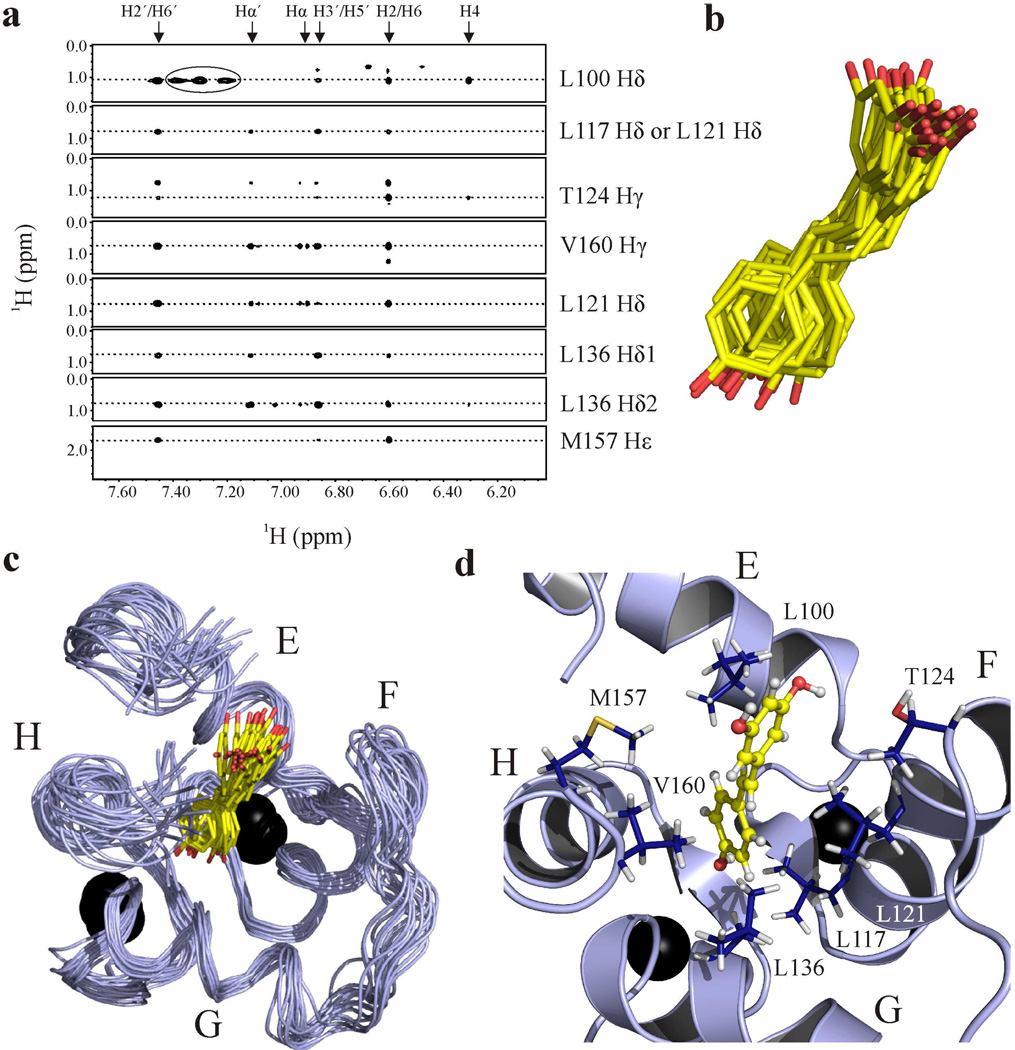
Fig. 5. Structure of the binary complex of cCTnC•resveratrol.
a. Strip plots showing the NOEs between resveratrol and cCTnC. The resveratrol assignments are at the top of the spectrum; cCTnC assignments are indicated on the right. Peaks that are circled represent intramolecular cCTnC NOEs that were not adequately filtered. b. Ensemble of resveratrol from the binary complex. The carbon atoms are shown in yellow and the oxygen atoms in red. c. 20 lowest energy structures of the cCTnC•resveratrol complex with the backbone trace of cCTnC in light blue; helices E to H are labeled. d. Resveratrol’s binding pocket on the lowest energy structure of cCTnC. Residues for which NOEs were measured are labeled and depicted in stick representation with carbon atoms colored in dark blue; resveratrol is shown in ball-and-stick representation (hydrogen atoms in white). Calcium ions are shown as black spheres.

