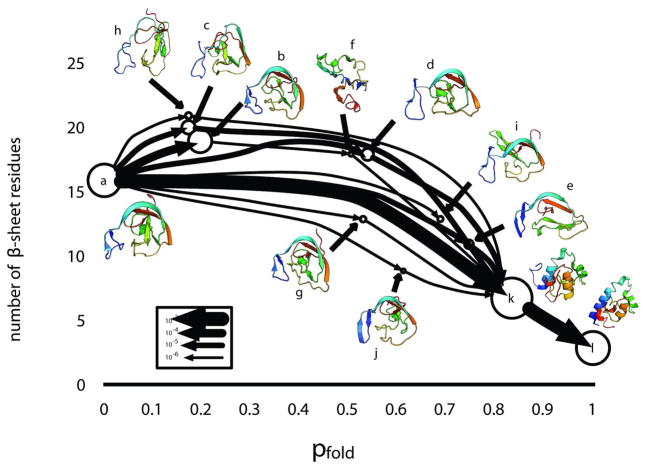
Figure 3.
A coarse-grained view of the 10 millisecond timescale transition with state sizes proportional to the log of the state’s equilibrium probability and arrow widths proportional to the log of the flux along the edge (see key in figure). The states are laid out in terms of the average number of β-sheet residues (calculated from 100 random conformations from each state) and the pfold (probability of reaching state in L before state A).

