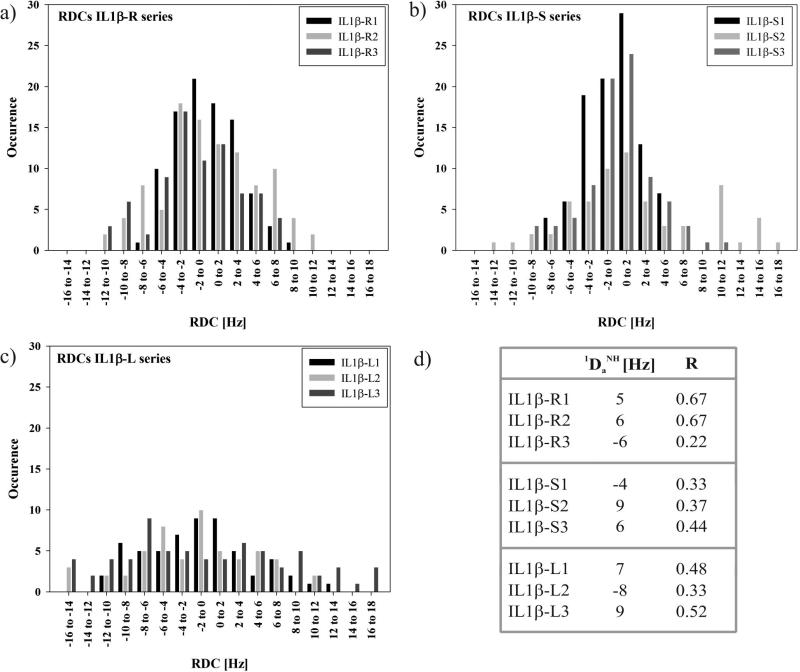
Figure 4.
(a) RDC histogram for IL1β-S1, -S2 and -S3. (b) RDC histogram for IL1β-R1, -R2 and -R3. (c) RDC histogram for IL1β-L1, -L2 and –L3. (d) . Estimated values of and R are obtained by nonlinear least-squares optimization of equations ; , and . The values of Dzz, Dyy and Dxx were measured from the histograms of the RDCs for IL1β-LBT by taking the extreme high and low values such that . Dxx corresponds to the most populated value in the histogram of the RDCs.78,79

