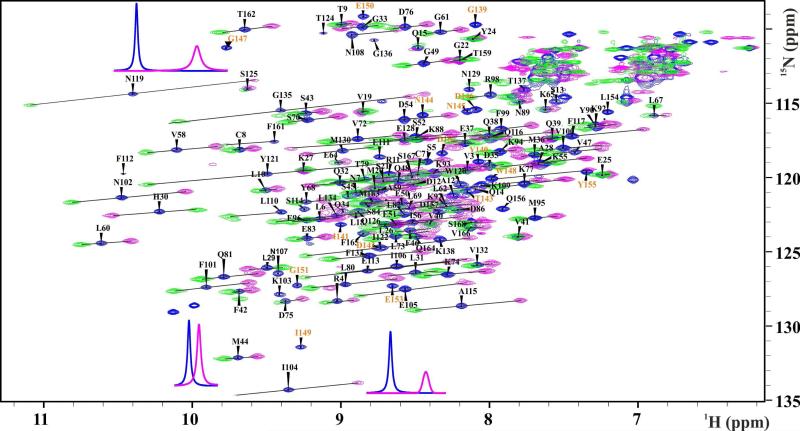
Figure 5.
1H-15N-HSQC spectrum showing the assigned backbone amide resonances of the sLBT-tagged interleukin-1β-R2 in the presence of 1.1 equivalents of diamagnetic Lu3+ (blue) and paramagnetic Tb3+ (pink) and Tm3+ (green). PCS vectors are indicated as black lines between corresponding diamagnetic and paramagnetic peaks. 1D spectra from the diamagnetic (blue) and paramagnetic (pink, Tb3+) experiments are shown for representative resonances indicating paramagnetic shift and signal broadening. Additional peaks resulting from the LBT sequence are annotated in orange.

