
Figure 2.
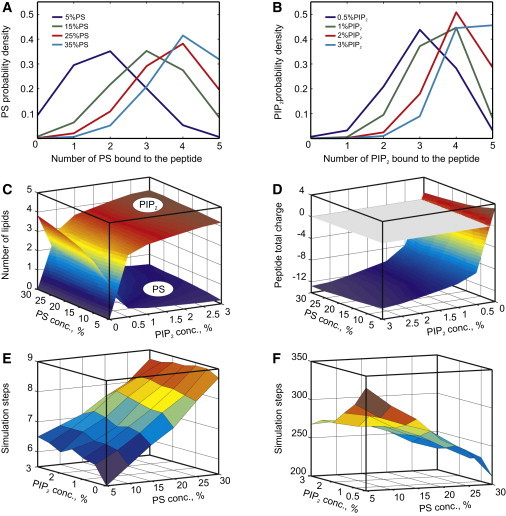
Interaction of the peptide with lipids. (A and B) Probability density functions of lipid association for PS and PIP2, respectively. For all plots in B, the PS fraction is 25%. (C) Average numbers of PS and PIP2 molecules associated with the peptide at varying lipid concentrations. (D) Charge of the peptide together with associated lipids. (E and F) Average peptide association times for PS and PIP2, respectively.