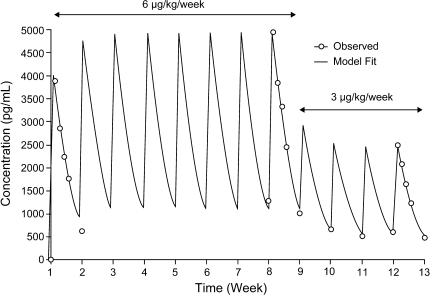
Fig. 1.
Mean serum concentration–time profiles of peginterferon α-2b following once-weekly subcutaneous dosing in patients who completed 12 weeks of protocol-specified therapy without dose modification and who had complete pharmacokinetic samples for weeks 1, 8, and 12 (n = 20). Experimentally observed values (open circles) as well as the curve-fitted line using a one-compartment pharmacokinetic model are included

