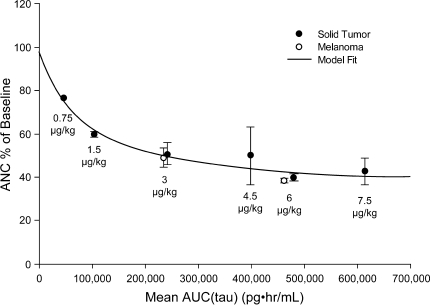
Fig. 2.
Relationship between peginterferon α-2b area under the concentration–time curve during the dosing interval (AUCtau) and absolute neutrophil count (ANC) changes as a percentage of baseline in patients with melanoma (n = 32) and solid tumors (n = 34) receiving various doses of peginterferon α-2b (3–12 patients in each dose group)

