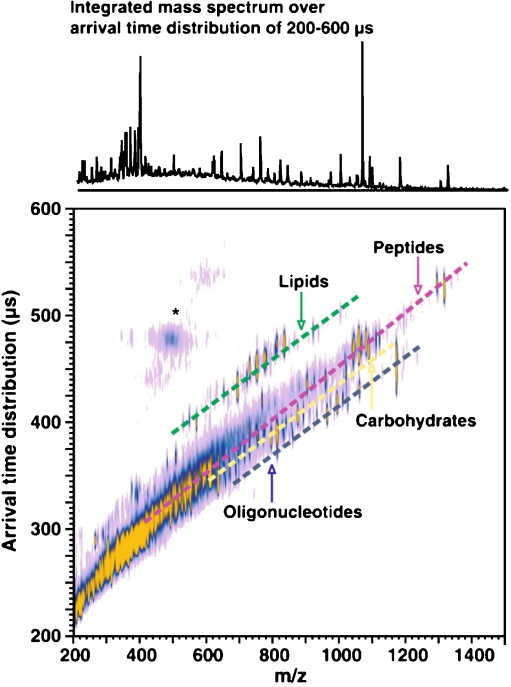
Fig. 1.
Matrix-assisted laser desorption and ionization (MALDI)–ion mobility mass spectrometry (MS) conformation space obtained for a mixture of model species representing each molecular class (ranging from seven to 17 model species for each class, spanning a range of masses up to 1,500 Da). Dashed lines are for visualization purposes, where each molecular class occurs in conformation space. Signals in the vicinity of the asterisk arise from limited post-ion-mobility fragmentation of the parent ion species. (Reproduced with permission from [41])

