
Fig. 3.
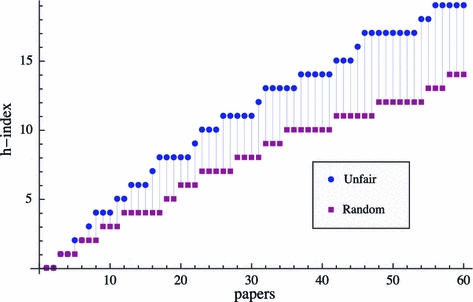
Development of h
p-index over published papers p for an author with θ = 3, career length T = 20, mean citation rate  with ν = 3 and α = 2
Official websites use .gov
A
.gov website belongs to an official
government organization in the United States.
Secure .gov websites use HTTPS
A lock (
) or https:// means you've safely
connected to the .gov website. Share sensitive
information only on official, secure websites.
Development of h
p-index over published papers p for an author with θ = 3, career length T = 20, mean citation rate with ν = 3 and α = 2