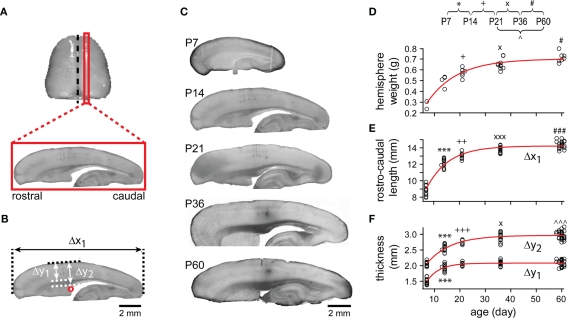
Figure 2.
Gross anatomical development. (A) Typical sagittal slices were cut at the cortical region 1.5–2.4 mm from midline (black dashed line). (B) The rostro-caudal cortical length (Δx1) was the maximal length of a section along the rostro-lateral axis. The neocortical thickness (Δy1) was measured vertically between pial and white matter, and the neocortical–callosal (neocortex + corpus callosum, Δy2) thickness was measured vertically from pial to the level of superior rostral part of lateral ventricle (red circle). Scale bar, 2 mm. (C) Representative pictures of sagittal slices at different ages. Scale bar, 2 mm. (D) The weight of all individual cerebral hemispheres examined was plotted as a function of animal age (P7: n = 3, P13–P14, simplified as P14: n = 3, P21–P22, simplified as P21: n = 7, P35–P37, simplified as P36: n = 10, P59–P61, simplified as P60: n = 7). The points were fitted with a single exponential line (red) of length constant (the time taken for each parameter to reach 63.2% of its final value from P7): 12.15 ± 2.03 days. For (E–F), the same conventions are shown as in (D). (E) Rostro-caudal cortical length (P7: n = 11, P14: n = 12, P21: n = 8, P36: n = 14, P60: n = 22). Length constant of exponential fit: 8.53 ± 0.71 days. (F) Neocortical thickness (Δy1) and neocortical–callosal thickness (Δy2; for both Δy1 and Δy2, P7: n = 13, P14: n = 13, P21: n = 8, P36: n = 15, P60: n = 28). Length constant of exponential fits: Δy1, 4.83 ± 0.68 and Δy2, 9.27 ± 0.95 days. Note, for this and subsequent figures, symbols representing statistical significance between ages: *, P7 and P14; +, P14 and P21; ×, P21 and P36; #, P36 and P60; ∧, P21 and P60. Significant levels: 1 (e.g., *), 2 (e.g., **), 3 (e.g., ***) symbols denote 0.01 < P < 0.05, 0.01 < P < 0.001, P < 0.001, respectively.

