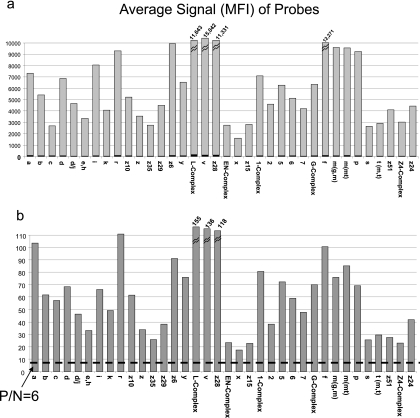
Fig. 2.
Signal strength of H antigen probes. (a) Raw data averages for five isolates run in the H antigen assay. The signal strength of each H antigen probe is expressed in median fluorescence units, as indicated by the gray bar. Negative-control signal strength is indicated in black on each bar. (b) Average ratios of positive/negative values for five isolates. A positive reaction is represented by a P/N ratio greater than 6.0, as indicated by a dashed line.

