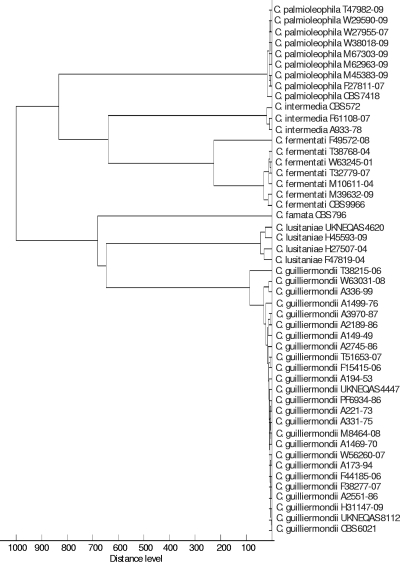
Fig. 3.
Score-oriented dendrogram using Euclidian squared distances and average linkages to cluster the MALDI-TOF mass spectra obtained for all included isolates. All samples were named based on molecular identification, illustrating the complete agreement between ITS sequencing and the MALDI-TOF spectra.

