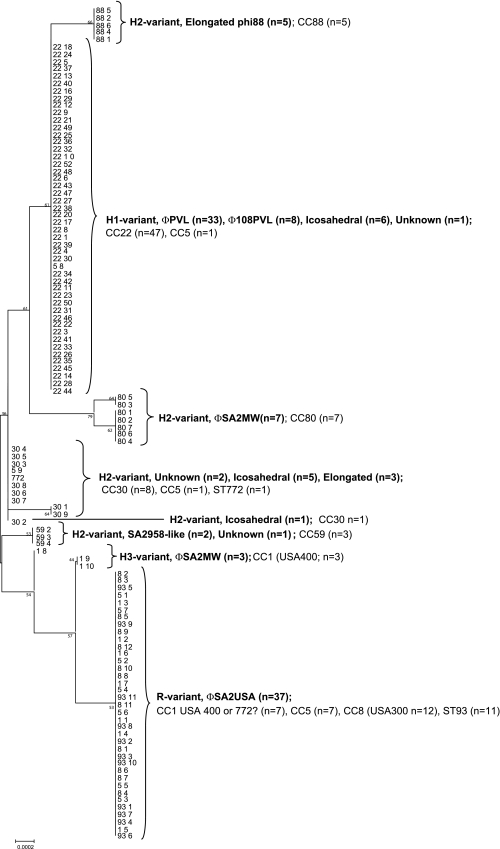
Fig. 2.
ML analysis tree with bootstrap values based on comparative sequence analysis; this suggests a possible evolutionary relationship to explain the variation in PVL sequence data for 114 PVL-MRSA strains. SNP profile groups are shown to cluster for PVL-encoding phages. For each of the 114 PVL-MRSA isolates, the first number corresponds to the MLST clonal complex (CC) and the second to the isolate number. Branching numbers represent bootstrap values.

