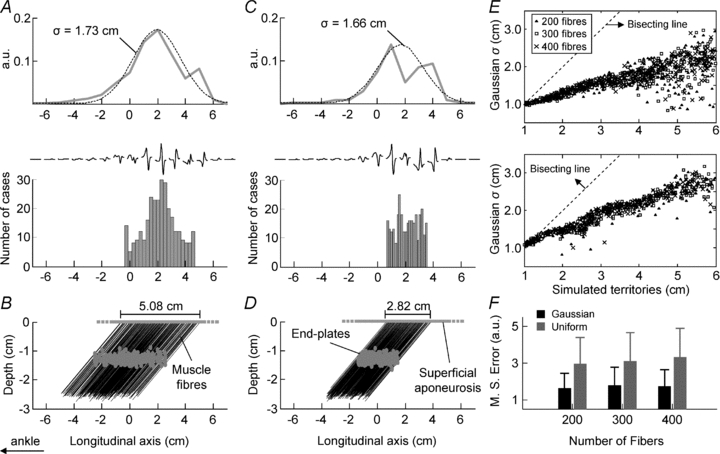
Figure 4. Surface representation of action potentials in pennate motor units.

A, the distribution of the ARV amplitude (grey line), its optimal Gaussian curve (dashed line), the histogram created with the position of the superficial aponeuroses of all muscle fibres of a single, simulated motor unit and its surface potentials. Note how closely the amplitude and the location of surface potentials relate to the distribution of muscle fibres. B, the location of end-plates and muscle fibres simulated for this motor unit. The location of the superficial aponeuroses was distributed normally along the simulated territory (5.08 cm). C and D, same as in A and B, for a simulated unit whose muscle fibres were distributed uniformly along its territory (2.82 cm long). E, plots of the standard deviations of Gaussians against the actual, longitudinal size of the territories of simulated motor units, for different territory densities (▴: 200 fibres; □: 300 fibres; ×: 400 fibres; n = 300 motor units). The upper and lower graphs show that the distribution of muscle fibres along the territory of each unit was Gaussian and uniform, respectively. Both distributions of fibres resulted in Gaussian curves significantly correlated with the size of the motor unit territories (Pearson R > 0.9, P < 0.0001). F, shows the mean error values (whiskers: standard deviation; n = 300 units) obtained by fitting the Gaussian curves to the ARV distributions, for motor units with 200, 300 and 400 fibres. When the fibres were distributed normally (black bars) within the unit territory the mean error was significantly smaller than that obtained for fibres distributed uniformly (grey bars) along the territory (ANOVA, P < 0.0001, n = 1800 units).
