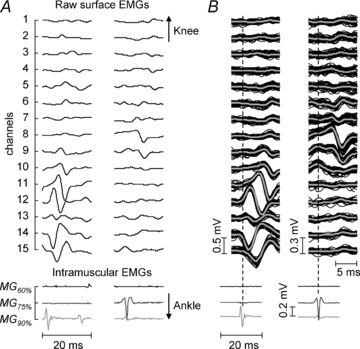
Figure 5. Local manifestation of surface motor unit action potentials.

A, a typical example of surface (top) and intramuscular (bottom) electromyograms recorded from the MG muscle of subject 7. The grey level of intramuscular traces denotes from which location these signals were recorded (see Fig. 2). Note the clear correspondence of the intramuscular potentials in the MG75% and MG90% locations with the surface action potentials on the middle (channels 8 and 9) and on the distal (from channel 9 to 15) portions of the array of electrodes, respectively. B, the surface potentials (top, black lines) and their average (thick grey line), triggered with the discharge pattern of intramuscular potentials shown at the bottom. Consistent and local representation of intramuscular action potentials is evident on the surface.
