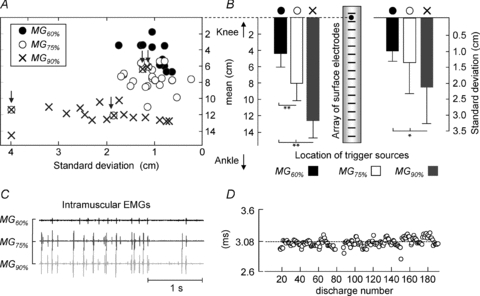
Figure 6. Localisation and spread of surface action potentials in the MG muscle.

A, the scatter plot of mean versus standard deviation values for the Gaussians optimally fitted to the distribution of surface ARV amplitude (n = 7 subjects), computed for intramuscular potentials in the three recording locations (•: MG60%; ○: MG75%; ×: MG90%). B, averaged values (whiskers indicate standard deviation) of the mean (left panel) and standard deviation (right panel) of the fitted ARV distributions. C, a short epoch (from 45 to 48 s) of raw intramuscular EMGs recorded from subject 3. The largest potentials in the MG75% location appear after the largest potentials in the most distal location, with a small and consistent delay, shown in D. This indicates that wire electrodes in both locations recorded from the same motor unit, resulting in Gaussians with the same mean and standard deviation (see arrows in A). The median delay of 3.08 ms is presumably due to small differences in the location of end-plates between different fibres of the same motor unit. Statistical significance for the multiple comparisons is reported as: *P < 0.05; **P < 0.001. n = 55 motor units.
