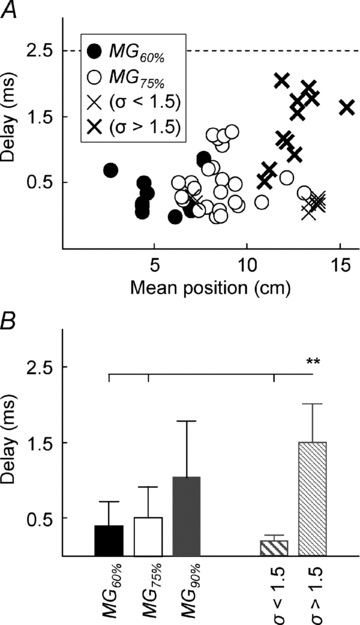
Figure 7. Delay values estimated between consecutive surface potentials.

A, plot of the delay between surface potentials recorded from adjacent channels versus the mean value of ARV distribution. Note that the delay estimated for surface potentials with highly dispersed ARV distribution (thicker crosses; σ > 1.5), is close to the delay expected for propagating potentials (2.5 ms is expected for electrodes spaced by 10 mm; propagation velocity of action potentials along muscle fibres range from 3 to 6 m s−1, Andreassen & Arendt-Nielsen, 1987). Therefore, on the most distal MG location, the amplitude of surface potentials reflects the length of muscle fibres rather than the territory of motor units (see Fig. 8 and Discussion). B, the mean values (whiskers correspond to the standard deviation) of the delay data shown in A. The delay values estimated for the MG90% location are higher (P = 0.0002) than those estimated for the other locations.
