
Figure 6.
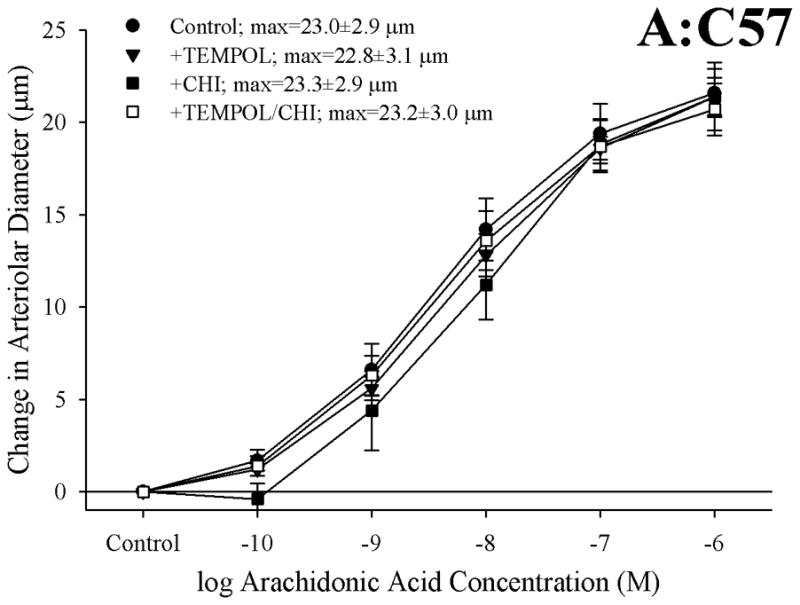
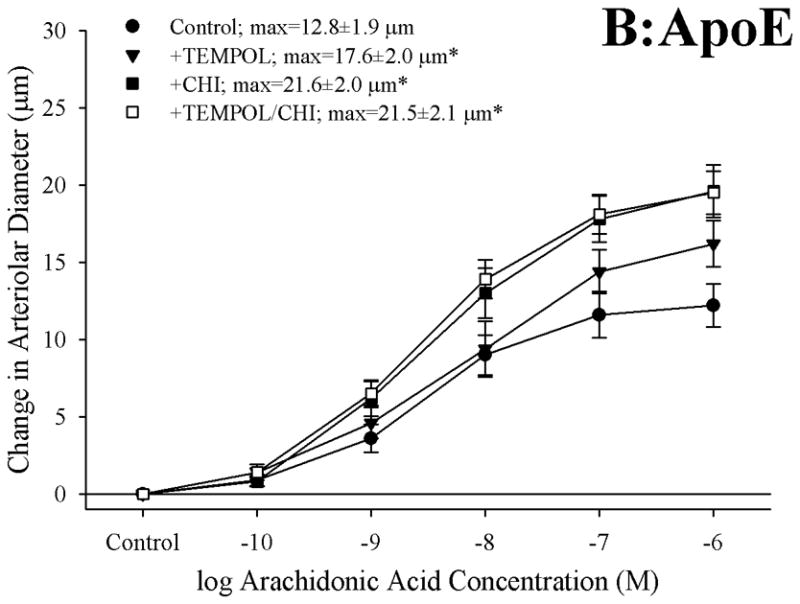
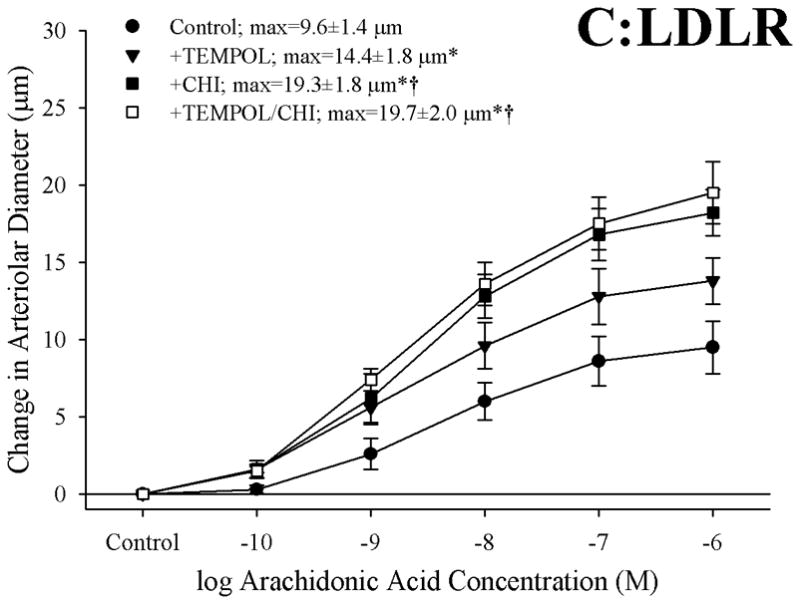
Data, presented as mean±SEM, describing the dilator responses of isolated skeletal muscle resistance arterioles of C57 (Panel A), ApoE (Panel B) and LDLR (Panel C) mice in response to increasing concentrations of arachidonic acid. Data are shown for arterioles under control conditions, following treatment of vessels with the antioxidant TEMPOL, following pharmacological inhibition of thromboxane synthase with CHI, and following treatment with both TEMPOL and CHI. n=8–10 animals for each group; * p<0.05 vs. control conditions; † p<0.05 vs. treatment with TEMPOL alone.