
Fig. 3.
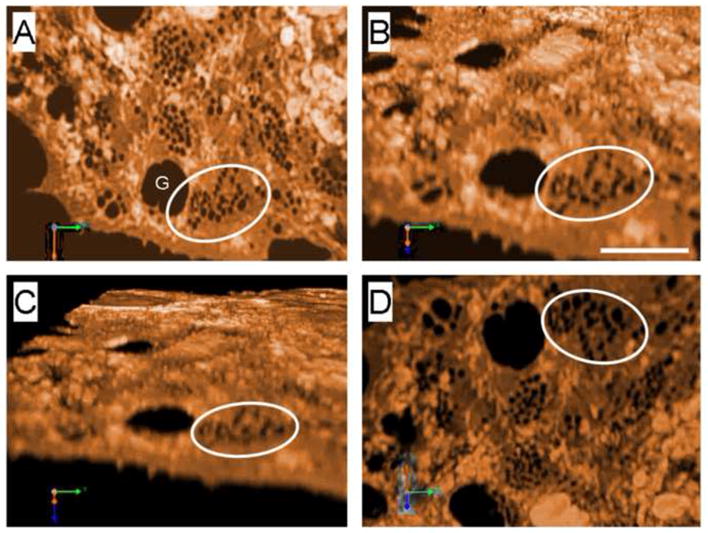
SIM of LSEC showing fenestrations clustered in sieve plates (the circle identifies the same sieve plate in each image). The image has been rotated so that Fig. 3A shows the top surface while Fig. 3D shows the underneath surface of the LSEC. (Scale bar 2 μm, G gap). A 3D movie is shown in the supplementary files.