
Figure 6.
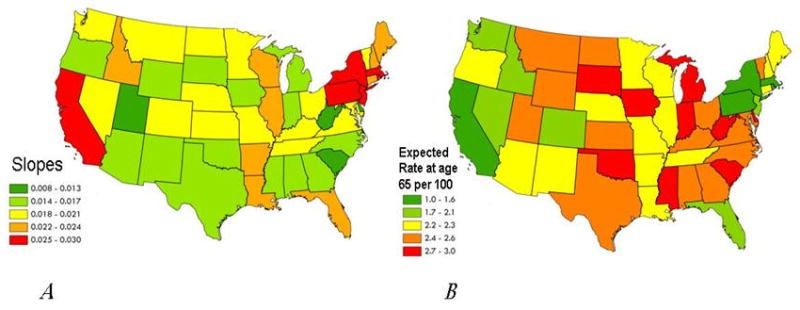
Geographic distributions of slopes (Panel A) and exponentiated intercepts (Panel B) for cancer-specific mortality rates, 2003-06
Official websites use .gov
A
.gov website belongs to an official
government organization in the United States.
Secure .gov websites use HTTPS
A lock (
) or https:// means you've safely
connected to the .gov website. Share sensitive
information only on official, secure websites.
Geographic distributions of slopes (Panel A) and exponentiated intercepts (Panel B) for cancer-specific mortality rates, 2003-06