
Figure 13.
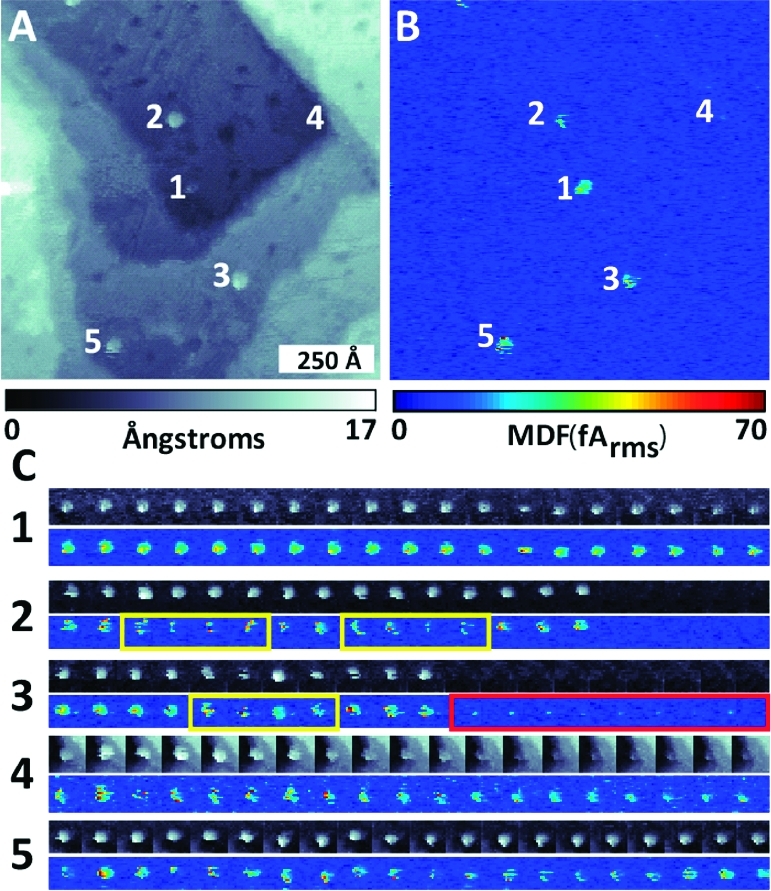
Simultaneously acquired (a) topographic and (b) polarizability STM images of a dodecanethiolate SAM with inserted nitro-functionalized OPE molecular switches. (c) Sequential images (30 s between frames) of individual switch molecules, showing instabilities in microwave polarizability image prior to visible switching in topographic image, and microwave peaks evident after topographic peak disappears. Adapted from ref (187).