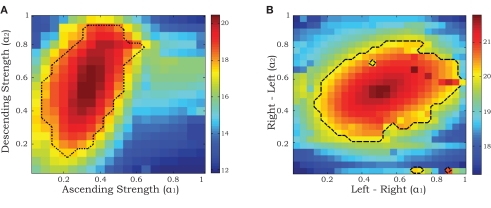
Figure 6.
Maximum log-likelihoods for the data from recorded pairs of motor units (ipsilateral R2–R3 in A and contralateral R2–L2 in B) for the stochastic phase model with fixed values of coupling strengths α1 and α2 ranging from 0 to 1. The dashed curves denote the boundaries of asymptotic 95% confidence regions based on likelihood-ratio tests (see Materials and Methods).

