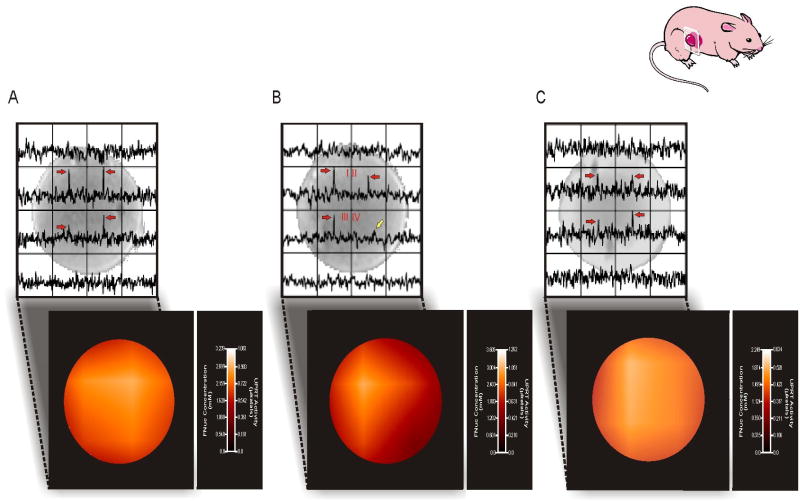
Figure 3.
In vivo imaging of transgene activity. 19FMRS images of FNuc (red arrows) and associated parametric maps of regional CD-UPRT levels and activity within CD-UPRT+ xenografts are shown. The inset cartoon indicates the slice orientation of the acquired images. 19FMRS enabled images demonstrating homogeneous enzyme activity (a) to be distinguished from xenografts exhibiting regional heterogeneities in CD-UPRT activity (b). An area of deficient CD-UPRT activity is evident within voxel IV and is underscored by the presence of unmetaboilized 5FU (yellow arrow). 19FMRSI was also able to discern CD-UPRT enzyme levels and activity in mixed xenografts grown from equal parts CD-UPRT+ and CD-UPRT- cells (c). Homogeneous CD-UPRT activity was seen; however, this activity is reduced in comparison to CD-UPRT+ tumors (a).

