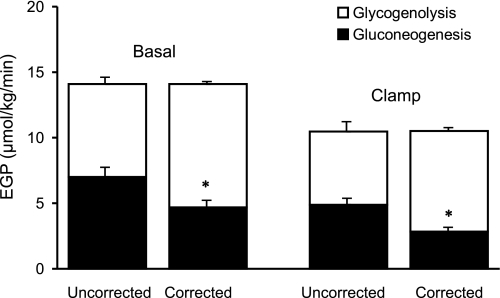
Fig. 6.
Contribution of gluconeogenesis (filled bars) and glycogenolysis (open bars) to endogenous glucose production (EGP) observed before (basal) and during the insulin infusion, calculated using the uncorrected and corrected ratios of the deuterium enrichment on position 5 and position 2 of plasma glucose. *P < 0.001 vs. uncorrected.

