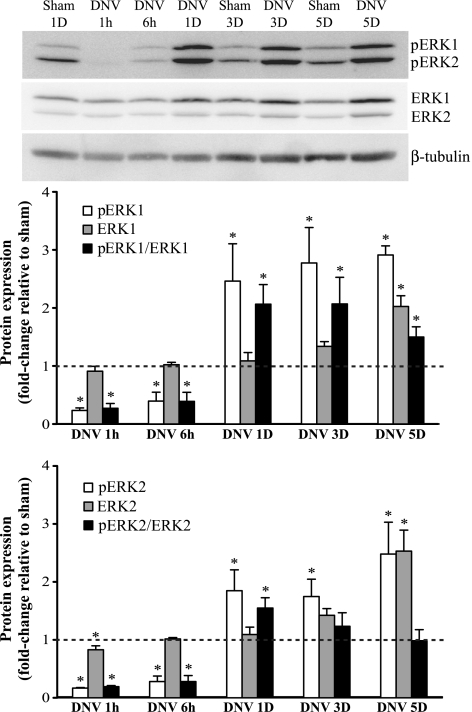
Fig. 3.
DNV-induced changes in phosphorylation of ERK½, as detected by Western analyses. Top: representative immunoblot of phospho-ERK½, ERK½, and β-tubulin for each DNV time point. Bottom: relative expression (means ± SE) of phospho-ERK½, ERK½, and the ratio of phospho-ERK½ to total ERK½, compared with sham control after normalization to β-tubulin. *Significantly different (P < 0.05; n = 6) from the average of all sham controls.

