Fig. 2.
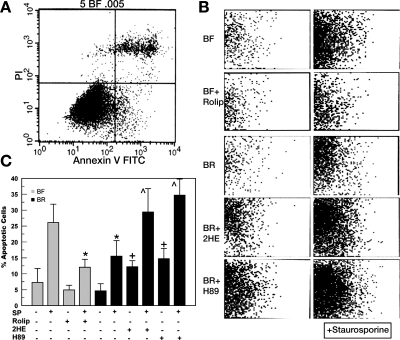
Quantitative assessment of apoptosis by flow cytometry. A: representative result from cells incubated in BF media; y-axis, propidium iodide (PI) fluorescence; x-axis, annexin V FITC fluorescence. Bottom right quadrant represents apoptotic portion of population. B: bottom right quadrants from representative experiments of cells incubated in BF or BR media and treated with 50 μM rolipram (Rolip), 10 μM 2-hydroxyestradiol (2HE), or 10 μM N-[2-(p-bromocinnamylamino)ethyl]-5-isoquinollnesulfonamide (H89), ± 10 nM SP. C: summary data. Values are means ± SE; n = 5. *Significantly lower than BF + SP; + significantly higher than BR; ^ significantly higher than BR + SP: P < 0.05.

