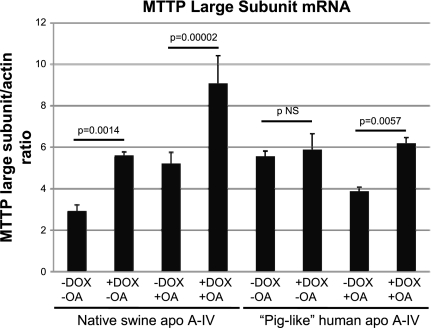
Fig. 4.
MTTP large subunit mRNA in IPEC-1 cells overexpressing native swine apo A-IV and piglike human mutant apo A-IV incubated for 24 h with and without 0.8 mM OA and with and without 400 ng/ml DOX as assessed by quantitative RT-PCR analysis using β-actin to control for sample loading. Bars represent mean values for the MTTP large subunit/β-actin ratio ± SE from 3 Transwells as described under methods. Statistical significance is indicated by 2-tailed P values.

