
Table 2.
Top expression changes significantly altered in all three HD mouse lines
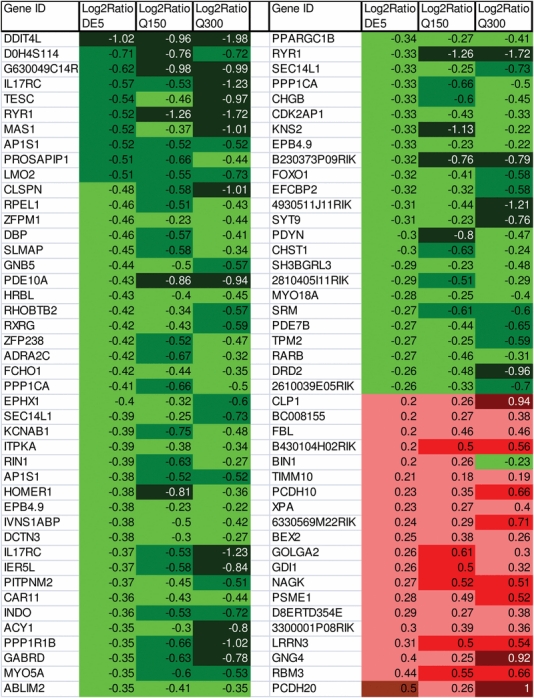 |
The top-ranked gene expression changes present in all three mouse models are shown according to UniGene ID symbol, along with a color-coded designation of direction and magnitude of change.