
Table 3.
Canonical pathways associated with shared and unique expression profiles of HD mice
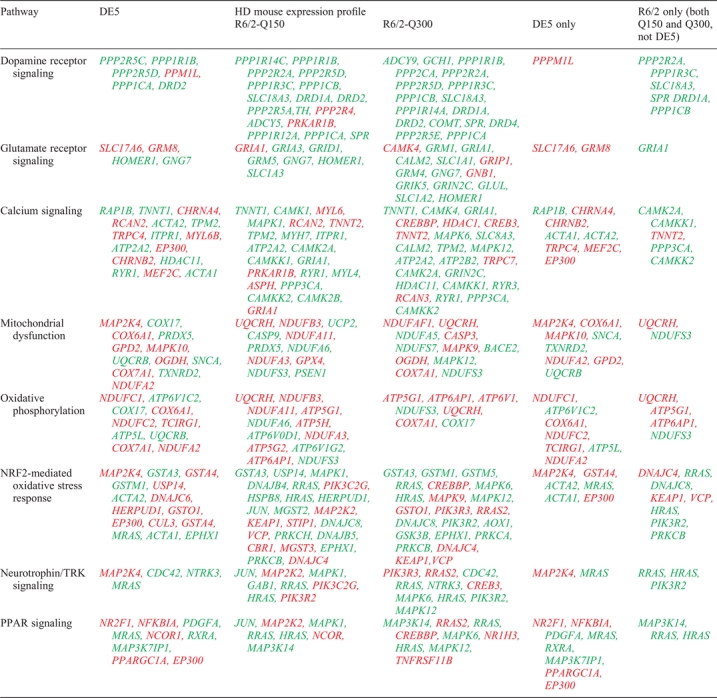 |
Canonical pathways analysis was run using Ingenuity Systems Pathway Analysis. Those pathways significantly associated with transcriptome profiles of the indicated condition are shown. Genes are indicated by their Official UniGene symbol. NS, not significant. Red indicates those genes upregulated in expression, while green indicates down-regulated genes.