Abstract
Repeats are indicators for the quality-imaging manager to schedule additional training and to be used as a basis for dialog with the reading radiologists to improve the service and quality to patients and referring physicians. Through the thoughtful application of software and networking, dose management, X-ray usage, and repeat analysis data can be made available centrally. This provides clinically useful technologist-centric results greatly benefiting an enterprise. This study tracked a radiology department’s use of a digital X-ray dashboard software application. It was discovered that 80% of the exams were performed by only 21% of the technologists and that the technologist with the highest throughput had a personal repeat rate of 6.5% compared to the department average of 7.6%. This study indicated that useful information could be derived and used as a basis for improving the radiology department’s operations and in maintaining high quality standards.
Key words: Workflow, radiology management, quality control, quality management, repeat analysis, productivity, dashboard, computed radiography, digital radiography, dose
Background
The transformation of the radiology department from analog to digital has provided many opportunities to improve workflow for technologists and radiologists.1–8 There are several peer-reviewed articles addressing the question or need for a form of higher level quality assessment in the digital X-ray department, but none is offering a software solution or a simple means of supporting managers and those responsible for overseeing the quality of digital X-ray imaging in becoming more effective and efficient in delivering the intended service.9–13
At the beginning of digital projection radiography, repeats, dose, and usage were only manageable by manually scribing ledgers or by printing to film and keeping every exposure as in the traditional workflow fashion. Both methods sacrificed workflow at the department level to enable digital radiographic imaging.
Several years after the introduction of computed radiography (CR), tools to collect exposure data, usage, and repeats became generally available on most systems. Traditionally, these tools have been CR reader centric and required queries of individual CR systems to determine the performance of each radiographer, followed by the manual aggregation of such data from several machines to produce a useful report to be used in the further training, coaching, and management of technologists.14–16
To address this need, software has been developed to aggregate data from across the enterprise’s computed radiography systems and provides a view of the activity within the general radiology department that is appropriately technologist-centric. The raw data, which is stored within each computed radiography reader is collected and presented in a workbook. Individual worksheets tabulate technologist’s use of each reader in the enterprise, specific cassettes as a function of body part and projection or technologist, repeat reasons as a function of technologists or cassettes, to name a few examples that can be derived from the accumulated data. It is expected this data will prove to be invaluable in helping radiology imaging managers improve workflow, patient care, and enhance departmental productivity.
Method and Materials
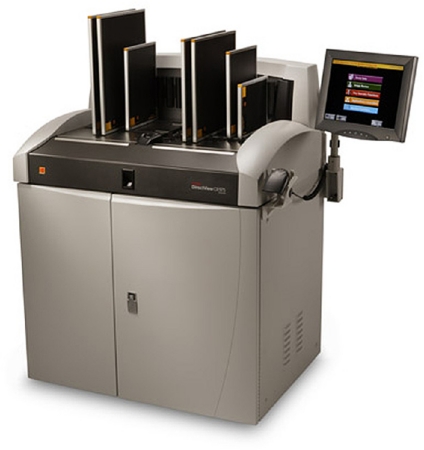
A prototype of the aforementioned software was implemented at a large children’s hospital in the Midwestern United States. The site’s CR systems included multiple Kodak DirectView CR 850s and CR 950s (Fig. 1). Not all systems at this facility were utilized for this prototype test period. The systems that were part of the study were integrated on a common network with remote operator panels (ROPs) allowing the technologist to perform the functions of identification (ID) and QC of patient images at a location remote from the CR reader itself. Carestream Health field engineers performed the necessary upgrade to the newest CR operating system and activated the radiology dashboard application software on the quality manager’s personal computer.
Fig 1.
Equipment being used and interrogated by the digital dashboard software.
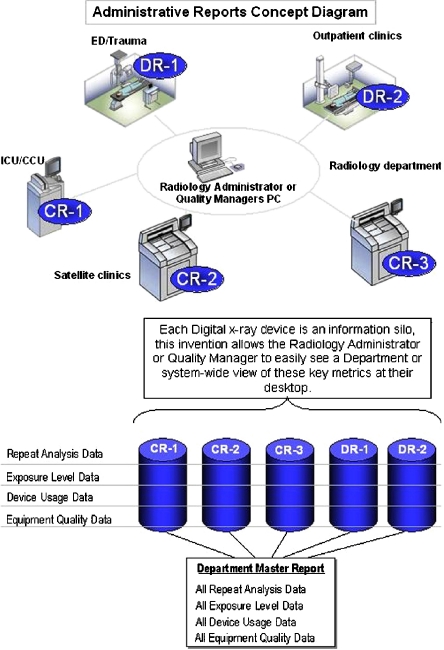
There are no additional steps to take interfering with the technologist’s workflow patterns to use this software application. It is an application that continuously collects and updates information in the background (Fig. 2). The protocol employed to collect the data parallels standard workflow patterns with computed radiography. Once identified and captured, the images undergo a quality inspection by the technologist. Subsequently, if the image is acceptable, it is ‘Approved’ by selection of the appropriate button on the CR or ROP graphic user interface (GUI). If rejected, the user must input the reason for the rejection among a set of predetermined reasons decided upon during installation or application training. These reasons are data based at the CR readers and are aggregated by the application software to produce the Digital Dashboard Excel© reports. Data was output to and analyzed using Microsoft Excel© running on a Windows XP/Intel© system. Once the data is resident on the identified quality user’s personal computer, macros can be developed to maximize the information garnered.
Fig 2.
Administrative reporting conceptual diagram.
Discussion
The digital dashboard was successful in producing reports from data acquired by remote systems and delivering them in a consolidated Excel format at a central PC residing in the imaging manager’s office. Pivot tables were used to analyze the accrued results in terms of elements listed in Table 1. There are 17 worksheets of data that can be used in the department’s analysis by the user, with an extra worksheet containing all the data resident in the CRs captured during the last software query.
Table 1.
Complete Data Set Being Monitored by the Radiographic Digital Dashboard.
| Data Set |
|---|
| Machine use by technologist |
| Exam mix by technologist |
| Exam type by machine |
| Exam mix by machine |
| Cassette usage |
| Cassette use history |
| Cassette use chart |
| Repeat summary |
| Repeat chart |
| Repeats by exam |
| Repeats by exam by technologists |
| Reject reason |
| Reject comments |
| Exposure statistics |
| Image adjustments |
| Technologist summary |
| Delivery statistics |
| Database page |
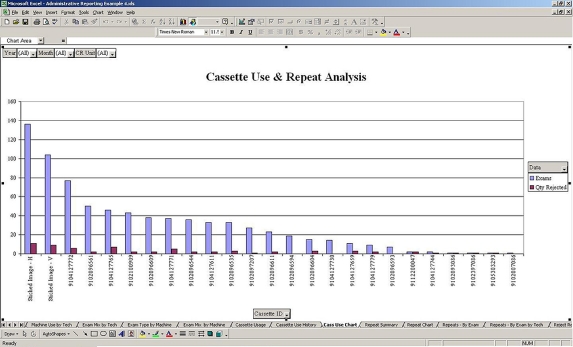
Figure 3 illustrates the view an imaging manager would see when opening up the ‘Cassette Use and Repeat Analysis’ worksheet, for example.
Fig 3.
Representative information when accessing the digital dashboard software.
This allowed, through simple analysis, the ability to identify areas in need of improvement. Table 2 lists the percentage of rejects with reasons as a function of the total number of rejects along with a number of other quantitative observations.
Table 2.
Operational Results Derived from the Digital Dashboard
| Operational Results |
|---|
| 1. 80% of the studies performed by 21% of the technologists |
| 2. Best technologist had lowest repeat rate (6.5 vs 7.6% department average) |
| 3. 41% of cassettes were used for 80% of the studies |
| 4. 7.6% of clinical images were repeated, 8.9% of images were rejected |
| 5. Repeats identified as |
| 43% Positioning |
| 12% Clipped anatomy |
| 17% Patient motion |
| 2% Artifact |
| 7% Out-of-range exposure index (mainly too low) |
| 19% Other |
| 6. 3 of 6 repeated scoliosis images were due to gonadal shielding being in the region of interest |
| 7. 81% of images were adjusted before being released |
| 8. 2 images, out of total of 766, failed to be delivered on the first attempt |
It was also proven quantitatively that the Pareto principle is very much evident in correlating the number of studies to the number of technologists. Of the studies, 80% were performed by 21% of the technologists. The best technologists, in terms of patient throughput, could also be correlated to having the lowest repeat rates (6.5% compared to the department’s average of 7.6%).
The test site identified that they could substantially reduce their repeats successfully by addressing only two exam types, patient motion, and positioning for scoliosis exams. As this facility was also engaged in testing a prototype imaging product for scoliosis, the evidence of a learning curve during this short test period is apparent in the data.
Conclusion
Recent advancements in software for certain CR, and soon to include DR systems, now allow a single consolidated view of key management metrics from across the department.
The ability to drill down allows users to quickly see what needs to be addressed for productivity improvements, from the managers’ office desktop. As such a QC management system can be viewed as the department administrator’s “digital X-ray dashboard” for this intrinsically distributed modality, the opportunity for more precise and frequent key parameter monitoring and intervention now exists.
OPEN ACCESS
This article is distributed under the terms of the Creative Commons Attribution Noncommercial License which permits any noncommercial use, distribution, and reproduction in any medium, provided the original author(s) and source are credited.
References
- 1.Reiner BI, Siegel EL, Carrino JA. SCAR Radiologic Technologist Survey: Analysis of the impact of digital technologies on productivity. J Digit Imaging. 2002;15(3):132–140. doi: 10.1007/s10278-002-0021-8. [DOI] [PMC free article] [PubMed] [Google Scholar]
- 2.Reiner BI, Siegel EL, Carrino JA. SCAR Radiologic technologist survey: Analysis of technologist workforce and staffing. J Digit Imaging. 2002;15(3):121–131. doi: 10.1007/s10278-002-0020-9. [DOI] [PMC free article] [PubMed] [Google Scholar]
- 3.Reiner BI, Siegel EL. Changes in technologist productivity with implementation of an enterprise-wide PACS. J Digit Imaging. 2002;15:22–26. doi: 10.1007/s10278-002-0999-y. [DOI] [PMC free article] [PubMed] [Google Scholar]
- 4.Reiner BI, Siegel EL, Hooper FJ, et al. Effect of film-based versus filmless operation on the productivity of CT technologists. Radiology. 1998;207:481–485. doi: 10.1148/radiology.207.2.9577498. [DOI] [PubMed] [Google Scholar]
- 5.Reiner BI, Siegel EL. Technologist productivity in the performance of general radiographic examinations: Comparison of film-based versus filmless operations. AJR. 2002;179:33–37. doi: 10.2214/ajr.179.1.1790033. [DOI] [PubMed] [Google Scholar]
- 6.Reiner BI, Siegel EL: PACS and productivity. In: Siegel EL, Kolodner RM Eds. Springer-Verlag, New York, NY, 1999, pp 103–112
- 7.Reiner BI, Siegel EL, Siddiqui K. Evolution of the digital revolution: A radiologist perspective. J Digit Imaging. 2003;16(4):324–330. doi: 10.1007/s10278-003-1743-y. [DOI] [PMC free article] [PubMed] [Google Scholar]
- 8.Wideman C, Gallet J. Analog to digital workflow improvement: A quantitative study. J Digit Imaging. 2006;19(1):29–34. doi: 10.1007/s10278-006-0770-x. [DOI] [PMC free article] [PubMed] [Google Scholar]
- 9.Nol J, Isousard G, Mirecki J. Digital repeat analysis: Setup and operation. J Digit Imaging. 2006;19(2):159–166. doi: 10.1007/s10278-005-8733-1. [DOI] [PMC free article] [PubMed] [Google Scholar]
- 10.Honea R, Blado ME, Ma Y. Is reject analysis necessary after converting to computed radiography? J Digit Imaging. 2002;15(1):41–52. doi: 10.1007/s10278-002-5028-7. [DOI] [PubMed] [Google Scholar]
- 11.Ertuk SM, Ordategui-Parra S, Ros PR. Quality management in radiology: Historical aspects and basic definitions. J Am Coll Radiol. 2005;2(12):985–991. doi: 10.1016/j.jacr.2005.06.002. [DOI] [PubMed] [Google Scholar]
- 12.Benedetto AR. Six Sigma: Not for the faint of heart. Radiol Manage. 2003;25(2):40–53. [PubMed] [Google Scholar]
- 13.Murphy PD. An annual strategy for total quality. Radiol Manage. 1992;14(3):58–63. [PubMed] [Google Scholar]
- 14.Adler A, Carlton R, Wold B. An analysis of radiographic repeat and reject rates. Radiol Technol. 1992;63(5):308–14. [PubMed] [Google Scholar]
- 15.Gadeholt G, Geitung JT, Gothlin JH, Asp T. Continuing reject-repeat film analysis program. Eur J Radiol. 1989;9(3):137–41. [PubMed] [Google Scholar]
- 16.Watkinson S, Moores BM, Hill SJ. Reject analysis: Its role in quality assurance. Radiography. 1984;50(593):189–94. [PubMed] [Google Scholar]


