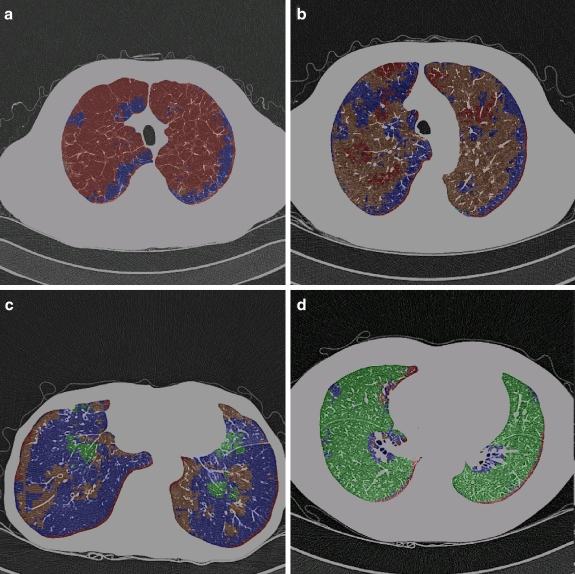
Fig 8.
Application of the classifier to differentiation of lung parenchyma. At every pixel, the semi-transparent color was coded by the classification result. (a) CT scan obtained in a patient with PLE. Most of the parenchyma was labeled as severe emphysema. (b) CT scan obtained in a patient with signs of CLE. Most of the classified samples were labeled as CLE. Some areas of the lung with homogeneously decreased attenuation and large air cysts were classified as BO or PLE. (c) CT scan in a patient with BO. Most of the parenchyma was labeled as BO, whereas some areas were classified as normal lung parenchyma. Areas of the lung with increased attenuation adjacent to areas of decreased attenuation allow the classifier to identify the texture of CLE in the vicinity of the major bronchi. (d) CT scan obtained in a healthy subject (window level, −850 HU; width, 400 HU) with automated classification. Samples classified confidently are labeled as normal. For color figures, please go to Springerlink to view the online version.

