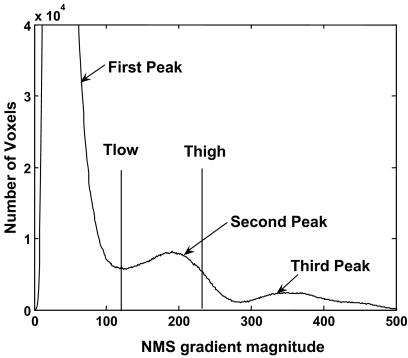
Fig 3.
Trimodal histogram of the nonmaximal suppression (NMS) gradient magnitude that serves to select the hysteresis threshold Thigh and Tlow for adipose tissue. The large first peak at the lower end of the gradient spectrum represents texture of the image background while the third peak for the highest gradient is associated with edges of calcified tissue. The second peak in the intermediate gradient range describes the edges of adipose tissue. Thigh was identified at two thirds of the magnitude of the second peak and Tlow coincided with the minimum (valley) between the first and second peak.

