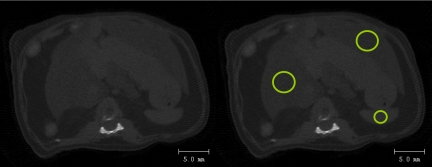
Fig 4.
Left: a raw μCT image from the region between the 13th thoracic and first lumbar vertebra was used to calculate the degree of fat in the liver. No contrast agent was used. Right: density values were determined for all voxels within the highlighted circular regions (12 mm2 for liver and 3 mm2 for spleen). These regions were selected as to be approximately in the center of the spleen and the left and right lobes of the liver. The average liver density of each mouse was calculated as the average of the two lobes.

