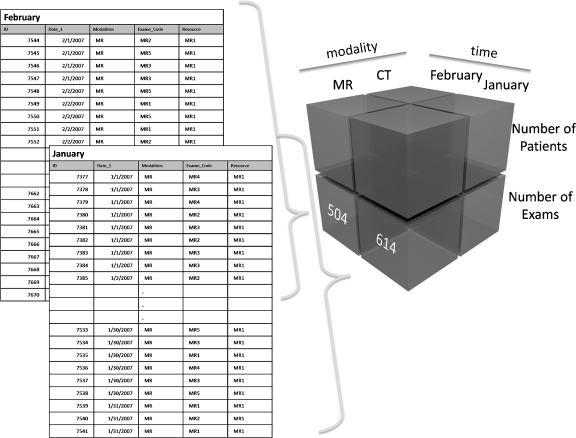
Fig 5.
Multidimensional database format (data cube). In this example the data is organized by modality, time and other measures (number of exams and number of patients). Each piece in the cube represents the total count of exams or patients (measures) in relation to the dimensions time and modality. A relational database is being represented on the left with tables containing the data for the months of January and February. A total of 614 MR exam counts in the January table and 504 in the February table are represented in the cube to demonstrate how the data can be “three-dimensionally” aggregated.

